July 13, 2023
The 6 Principles of Modern Data Architecture
Every once in awhile, the ultimate question comes up: *“What is the best analysis tool for BI on Hadoop?!” * AtScale is not in the business of favoring one tool versus the other. We are in the business of making all of them work. There are indeed many reasons why business users and IT departments choose particular analysis tools. Here are a few things to consider.
The question behind the question
If you’re asking yourself this question, it’s probably because you’re trying to determine how to best serve the needs of your business, particularly when you’re dealing with large amounts of data (across multiple data sources) and when the need of your business users are very disparate, especially as they span across multiple business units and use-cases.
Sarah Gerweck, one of our co-founders, authored a great piece on Information Management on the “History of Business Intelligence”. The piece answers “Why Most Business Intelligence Tools Fail the Hadoop Test”. We suggest you use this piece as a checklist for your Hadoop analytics deployment.
It’s not just about the BI features
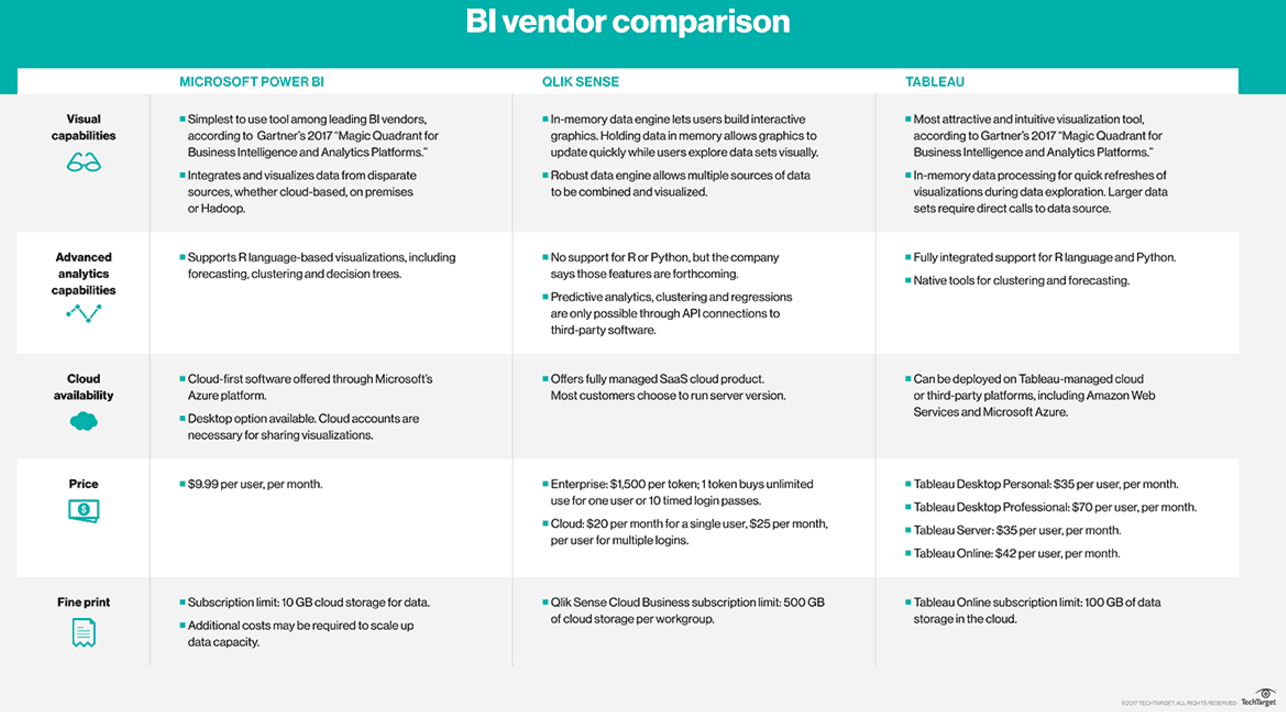
The BI tool that your team, IT group or company have chosen are most likely to be the most appropriate for their individual use-cases. TechTarget just published a table showing Tableau vs. Power BI, Tableau vs. Qlik Sense and Qlik Sense vs. Power BI, (see snapshot below). You’ll find that each BI tool has different advantages and price points. Don’t use this document as the only guide for your projects though. For one, it will probably be restrictive. Gartner profiled 24 BI tools in their latest Magic Quadrant. Secondly, there is a reason why BI users like their BI tools. Drill into the use cases! Start here to see the most common Analytics on Big Data use-cases enterprise leaders succeed with.
What users want…and what they can expect
Meta Brown, a revered author in the field of analytics highlighted recently the top 3 requirements for making Analytics successful. The bottom line though is that your people need access to all the data, now and fast.
By ‘all the data’, she means data in its aggregated form AND in its most atomic form Before you shop for the best BI tool, ask yourself if your architecture choice will serve that need well. There is no point getting a beautiful interface if your architecture can’t support a user’s needs for the data that allows them to provide value to your company.
By ‘now’, we mean that people can only drive impact if the data they have in front of them is a representation of a reality they can affect. If it takes hours to extract data out of its source, if it takes hours to reformat it and move it around to fit the shape that works with only one of your analysis tools, what’s the point?! So, before you pick the best visualization tool, ask yourself: does my company still live in the ‘era of the datamart’?, Does it still take us hours or days to get the data to the people who need it? If so, apply a standard cost to that wait. One of our customers found that each hour lost could potentially cost them $10,000. What is the cost of an hour of missed opportunity for your company?
These questions are way more relevant to the type of visualizations your team will need. Plus, some of the current market leading BI tools have built-in limitations your team should be aware of. Getting to ‘fast’ can be a challenge if you’re only dealing with platforms that were built 20 years ago. Did you know that the average age of the BI tools profiled in the “G2 Crowd Grid for Business Intelligence Software” is 22 years old?!
The bottom line
Your team has to be able to pick the tools that serve the business the best. Don’t feel bad if that means you need 10 different BI tools to accomplish that. That is the reality in the enterprise and there is no indication that this will ever change. In fact, as new BI tools come to the fore, the likelihood that you’ll deal with more BI tools is high.
As the Business Intelligence industry evolves, standardization will most likely not occur at the visualization layer or the data platform level, it will happen between them. Want to succeed in this new world? Download the cheat sheet below!
NEW BOOK